Market Profile TPO (Time Price Opportunity) histogram. Segmentation by session. 1-minute TPO. High resolution level size. Balance indication by line. TPO Count Imbalance indication on range background by opacity. Imbalance evaluation by Point of Control (TPOC). Histogram sizes relative to segment with highest price level TPO.
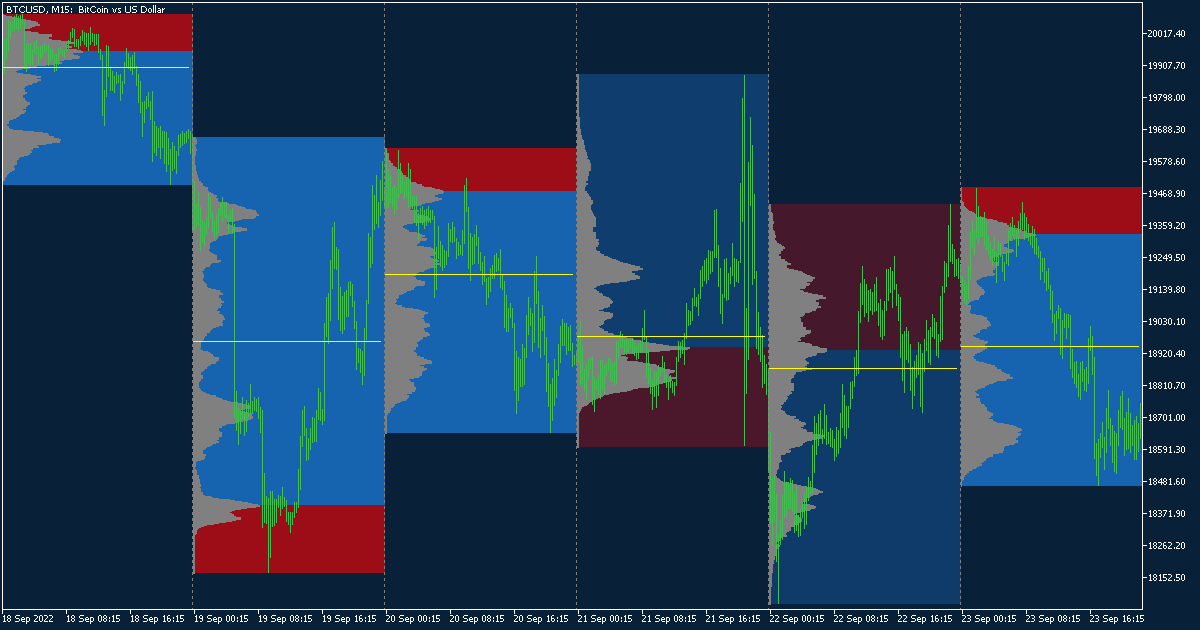


Chart Template Documentation
Note: This chart template has a relative range selection, and absolute segmentation and TPO period size method setting, the intended chart timeframe is 15 Minutes (M15), change with the Dataset Range, Dataset Segment and Market Profile TPO Period parameters.
General disclosure: Materials, information, and presentations are for software feature educational purposes only and should not be considered specific investment advice nor recommendations. Risk disclosure: Trading currencies, equities, indices and commodities involves substantial risk of loss and is not suitable for all investors. An investor could potentially lose all or more than the initial investment. Risk capital is money that can be lost without jeopardizing ones financial security nor life style. Only risk capital should be used for trading and only those with sufficient risk capital should consider trading. Past performance is not necessarily indicative of future results.