Help Center
Installation
To install or update open the MetaTrader 4 or 5 terminal, specify your MQL5 account in the settings, go to Toolbox \ Market \ Purchased and click the 'Install' or 'Update' button. Installation location is in the Data Folder MQL4|MQL5\Indicators\Market subfolder of the terminal directory, load the indicator on charts via the 'Navigator' window or menu bar. For details on loading the free demo, see How to Use the Free Demo.
To install or update extensions and resources, which are distributed separately via this website, use the package installer (.exe), see How to Install Extensions and Resources. Alternatively for manual installation, download the package binary (.zip) or individual files and extract/copy to the respective application and file type folder(s) in the terminal directory, then refresh the 'Navigator' window or restart the terminal. Load extensions on charts via the respective application type, i.e., Expert, Indicator and Script, view in the 'Navigator' window or menu bar. Primary application of type is, Experts run continuously, i.e., no reload on change of chart timeframe, and Scripts run once and unload. For quick access to the terminal directory use command 'Open Data Folder' in the File menu.
Quick Start
For a quick start browse example compositions and download chart templates (.tpl). Apply chart templates via the menu bar or context menu (right mouse click), see How to Use Chart Templates. For examples with range selection by absolute method, manual setting of compatible chart timeframe period is required. Adjust the range selection parameters to use on other timeframes, or set a relative range selection method option to make compatible for all timeframes. Similarly this applies for TPO period set by absolute method. Examples use a chart color scheme via the indicator parameter 'Color Scheme' under 'Chart Properties' set it to default to prevent overrides and to make changes via the chart properties window instead.
For details on configuration options and methods reference documentation. Get started with an introduction to features and functions, and with the input parameter lists, use the indicator properties window 'Inputs' tab to make new configurations, or view and optionally edit settings of examples, by function and parameter.


Market Profile displays the quantity and indices of time periods per price level. Units are named TPO's, short for Time Price Opportunity. Market Profile is a charting technique by J. Peter Steidlmayer, a trader at the Chicago Board of Trade (CBOT), ca 1959-1985.
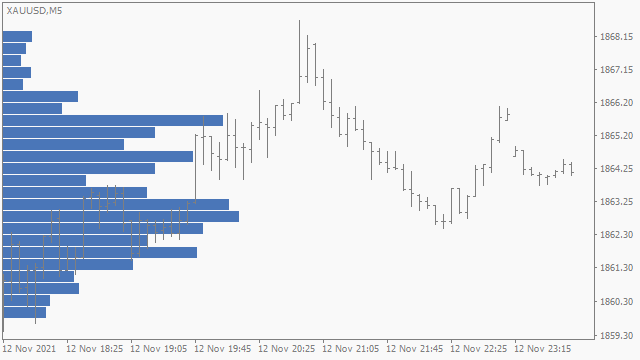 Volume Profile Histogram
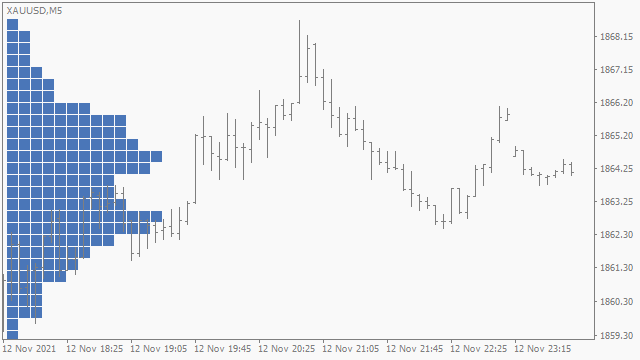 Market Profile TPO Block Structure
Tick Volume is the quantity of data ticks, data used in analytics to represent activity based on data feed updates with classification by Price Action.
Use mode History Ticks + Real-time Ticks to store data tick-by-tick on disk which is persistant on redistribution.
Use an absolute range selection method, e.g, Range Date/Time, or relative method by time, e.g., Range Days.
Templates (.tpl extension) are to configure charts they contain chart property settings including configurations of all applications attached to it. Templates can be saved and loaded via the menu bar or context menu.
INI files (.ini extension) are to configure indicator specific functions they contain global settings, and values of text input parameters to load by reference. INI files can be edited with a text file editor.


