LIVE Gold Spot XAUUSD - July 2th, 2024 · Market Profile TPO (Time Price Opportunity) letter structure and Volume Profile histogram. Tick volumes distribution. Bid price chart. Chart auto scroll and price scale. Current week range selection. Segmentation by London session with two distinct instances for Regular and Extended/Overnight Trading Hours (RTH and ETH/ON). 30-minute TPO. show moreVolume Profile histogram sizes and colors absolute for each segment. Initial Balance (IB). Volume Profile High and Low Volume Nodes (HVN and LVN) indication on object. Market Profile TPO Value Area (VA) indication by marker box. Point of Control (TPOC), start and end on object. End additionally by marker box and median by line. Volume Profile price level volume metric number display next to histogram.

Chart Template Documentation


Market Profile displays the quantity and indices of time periods where prices occurred per price level. Units are named TPO's, short for Time Price Opportunity. Market Profile is a charting technique by J. Peter Steidlmayer, a trader at the Chicago Board of Trade (CBOT), ca 1959-1985.
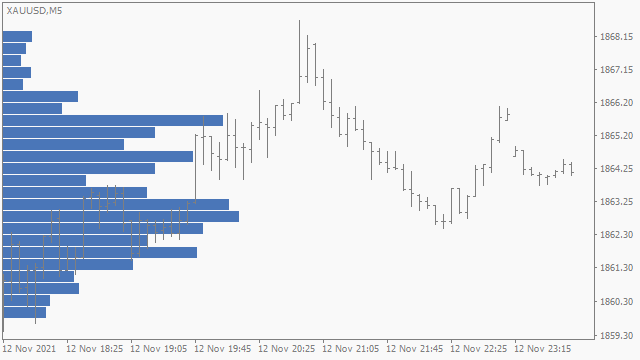 Volume Profile Histogram
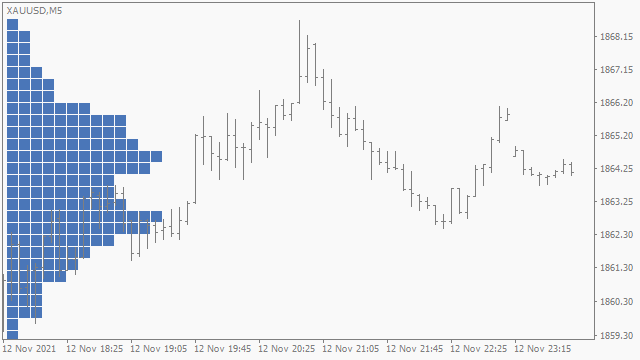 Market Profile TPO Block Structure
Tick Volume is the quantity of data ticks, data used in analytics to represent activity based on data feed updates.
Other factors might be a large dataset range, high amount of segments, small price level size and/or small TPO period size. More specific to the terminal is the total activity, i.e., resource utilization, of all attached chart application instances and Market Watch symbols. For calculations of multiple attached indicators the possibility of delay by single thread operations, i.e., MetaTrader 5 utilizes a separate thread to operate indicators for each symbol. If historical data is not downloaded before attaching an indicator instance to a chart distributions will be discarded and recalculated for each time new data is received until set timeout.
Templates (.tpl extension) are to configure charts they contain chart property settings including configurations of all applications attached to it. Templates can be used via the menu bar or context menu.
INI files (.ini extension) are to configure advanced or less frequently used settings and can be edited with a text file editor. For the Volume by Price Indicator they contain input parameter settings and can be used via the indicator's properties window 'Inputs' tab by file path as text input parameter values.


General disclosure: Materials, information, and presentations are for data visualization software feature educational purposes only and should not be considered specific investment advice nor recommendations. Example composition charts shown with indicators configured, including ranges and chart scales, strictly for best viewing with these purposes. Risk disclosure: Trading currencies, equities, indices and commodities involves substantial risk of loss and is not suitable for all investors. An investor could potentially lose all or more than the initial investment. Risk capital is money that can be lost without jeopardizing ones financial security nor life style. Only risk capital should be used for trading and only those with sufficient risk capital should consider trading. Past performance is not necessarily indicative of future results.