Data Visualization and Analytics
What is the difference between Volume Profile and Market Profile TPO?
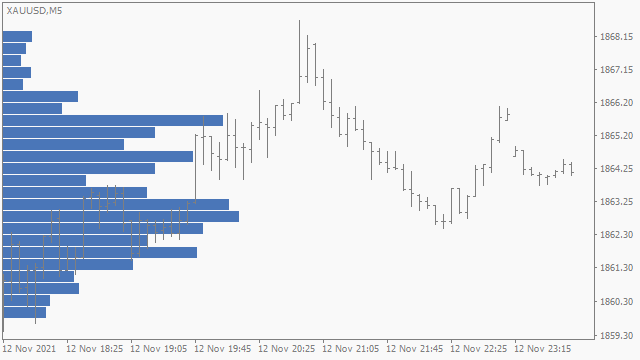
Volume Profile displays the quantity of buy and sell orders (Real Volume), or data ticks (Tick Volume) per price level.
Market Profile displays the quantity and indices of time periods per price level. Units are named TPO's, short for Time Price Opportunity. Market Profile is a charting technique by J. Peter Steidlmayer, a trader at the Chicago Board of Trade (CBOT), ca 1959-1985.
 Volume Profile Histogram
Market Profile TPO Block Structure
Volume Profile Histogram
Market Profile TPO Block Structure
Market Profile displays the quantity and indices of time periods per price level. Units are named TPO's, short for Time Price Opportunity. Market Profile is a charting technique by J. Peter Steidlmayer, a trader at the Chicago Board of Trade (CBOT), ca 1959-1985.
 Volume Profile Histogram
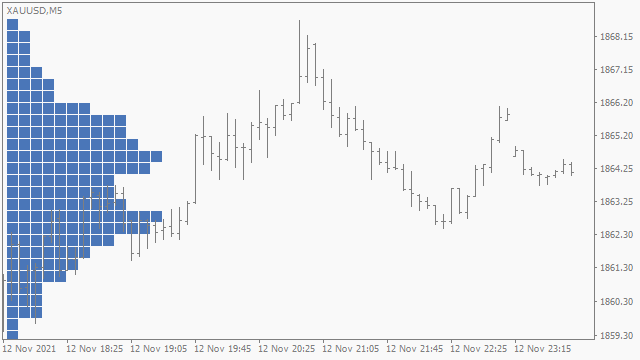 Market Profile TPO Block Structure
What is the difference between Real Volume and Tick Volume?
Real Volume is the quantity of buy and sell orders, data used in analytics to represent activity based on monetary value and classification, inherent to the market or type of instrument data might not be available, i.e., Forex and CFD's without access and value respectively.
MetaTrader 4, for use with CFD brokers, natively does not feature Real Volume, the indicator adds support via its Data Source Application Program Interface (API) for use with equities, indices and commodities CFD's, i.e., CFD for stock or futures exchange contract.
Tick Volume is the quantity of data ticks, data used in analytics to represent activity based on data feed updates with classification by Price Action.
Tick Volume is the quantity of data ticks, data used in analytics to represent activity based on data feed updates with classification by Price Action.
Data Feeds and Connections
Which data is provided with the indicator?
The indicator does not provide data. Data used is provisioned by the broker server the terminal is connected to. With MetaTrader 5 Custom Symbols, and with either platform via the indicator its Data Source Application Program Interface (API) cross-platform and third-party data source connections can be made.
Which brokers provide Real Volume data?
All MetaTrader 4, and most MetaTrader 5 brokers are CFD brokers, CFD brokers only provide Tick Volume, and not Real Volume as might with exchange stocks and futures brokers.
What are the differences in Real Volume data?
The scope of Order Book data is of the stock or futures exchange, i.e., Market Data, or of the brokerage clients trade operations only as in most cases. For demo accounts other limitations and adjustments.
What is the difference between Top of Book (Level 1) or Market Depth (Level 2) data?
Top of Book Level 1, the Time and Sales (T&S) list, is the trade operation data for volume indicators such as Volume Profile and Footprint. Market Depth Level 2 additionally provides data required for the Depth of Market (DOM) Column or Ladder.
How to connect Top of Book (Level 1) or Market Depth (Level 2) data?
For MetaTrader 5 as a Custom Symbol. For MetaTrader 4 cross-platform, and third-party data connections with either platform, use the indicator its Data Source Application Program Interface (API).
Configurations and Troubleshooting
Why does repaint occur after chart timeframe or price scale change?
The default dataset feed mode History Bars + Real-time Ticks Accumulation stores distributions in-memory. Chart timeframe and price scale must be maintained or redistribution might occur (on movement outside of the current scale) and tick accumulation is restarted, using coarse historical bar data up to that time.
Automatically maintain price level grid with the Chart Scale Fix Auto application module.
Use mode History Ticks + Real-time Ticks to store data tick-by-tick on disk which is persistant on redistribution.
Use mode History Ticks + Real-time Ticks to store data tick-by-tick on disk which is persistant on redistribution.
Why does shift occur after chart timeframe change?
Range selection method options such as the default Range Window = 80 and Range Bars = 97:-95 are relative to chart bars.
Range selections are set on initialization which, for Indicator type chart applications, includes change of chart timeframe.
Use an absolute range selection method, e.g, Range Date/Time, or relative method by time, e.g., Range Days.
Use an absolute range selection method, e.g, Range Date/Time, or relative method by time, e.g., Range Days.
How to use .tpl, .set and .ini files?
Set files (.set extension) are to configure chart applications (e.g., type 'Indicator' and 'Script') they contain application input parameter settings. Set files can be saved and loaded via the application's properties window 'Inputs' tab. Set files can be edited with a text file editor to create subcollections to overload.
Templates (.tpl extension) are to configure charts they contain chart property settings including configurations of all applications attached to it. Templates can be saved and loaded via the menu bar or context menu.
INI files (.ini extension) are to configure indicator specific functions they contain global settings, and values of text input parameters to load by reference. INI files can be edited with a text file editor.